JVM Incident Case Study #1: How 191,782 Virtual Threads Exhausted a 128 MB Heap in 23 Seconds
JVM Incident Case Study #1
How 191,782 Virtual Threads Exhausted a 128MB Heap in 23 Seconds
JVM troubleshooting is rarely about reading a single file.
A GC log tells one story.
A thread dump tells another.
A heap dump tells yet another.
The real root cause often only becomes obvious after correlating all three.
This case study shows exactly that.
The Incident
A benchmark application crashed with OutOfMemoryError after running for about 23 seconds.
Available diagnostic artifacts:
- GC log
- Thread dump (
jstack) - Heap dump
Individually, nothing looked catastrophic.
Together, they revealed a textbook case of unbounded virtual thread creation under a tiny heap.
Step 1 — GC Log Analysis
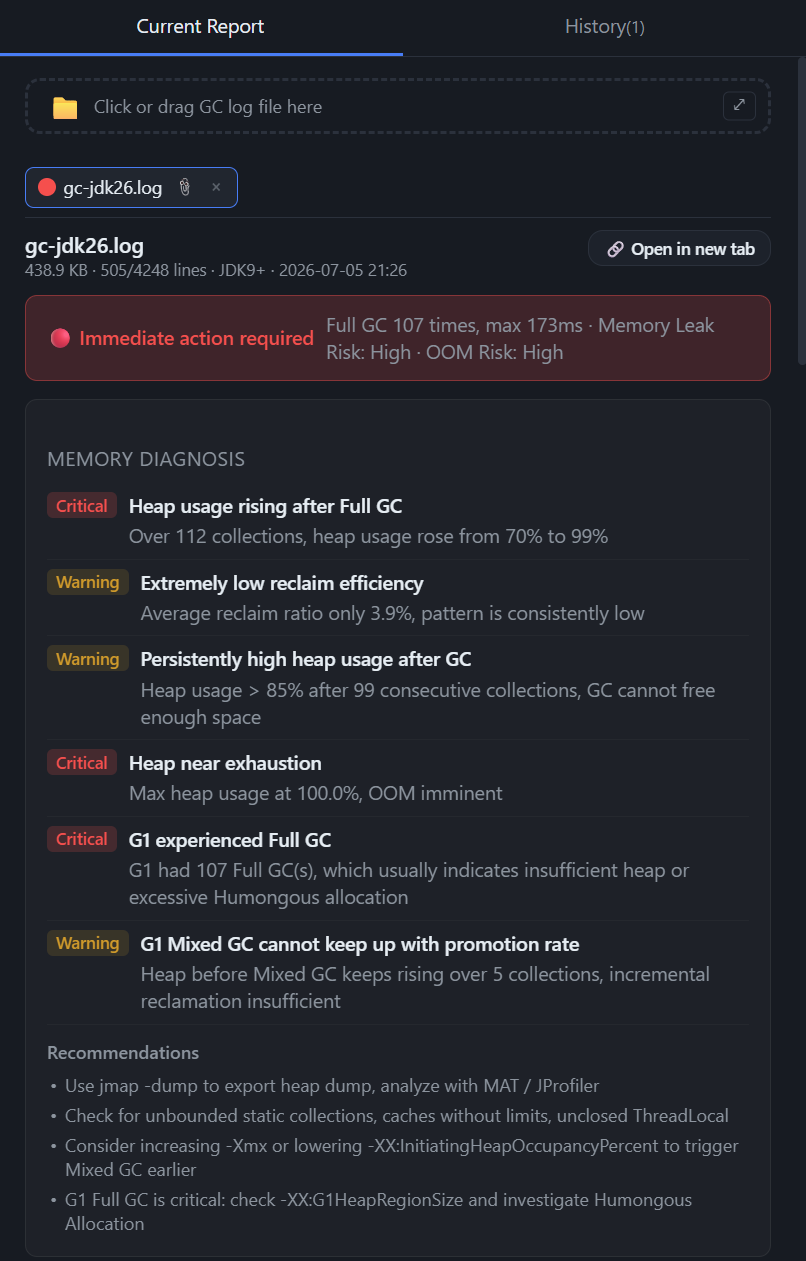
The GC report immediately showed severe distress.
| Metric | Value |
|---|---|
| Total GC events | 266 |
| Full GC events | 107 |
| Runtime | 23 seconds |
| Application throughput | 15.7% |
| Allocation rate | 157 MB/s |
The most important signal was the Full GC result:
127MB → 127MB
Almost zero memory was reclaimed.
When Full GC cannot reclaim memory, the issue is usually not that GC is broken. It often means the objects are still alive and strongly reachable.
Screenshot Placeholder
Interpretation
The JVM performed:
- 266 GC events in 23 seconds
- Around 11.5 GC events per second
- 107 Full GCs
- Only 15.7% application throughput
In other words, the JVM spent more than 84% of the time in GC.
The heap was only 128MB.
At an allocation rate of 157MB/s, the heap could be filled more than once per second.
The key question became:
If GC is running constantly, why is almost nothing being reclaimed?
Step 2 — Thread Dump Analysis
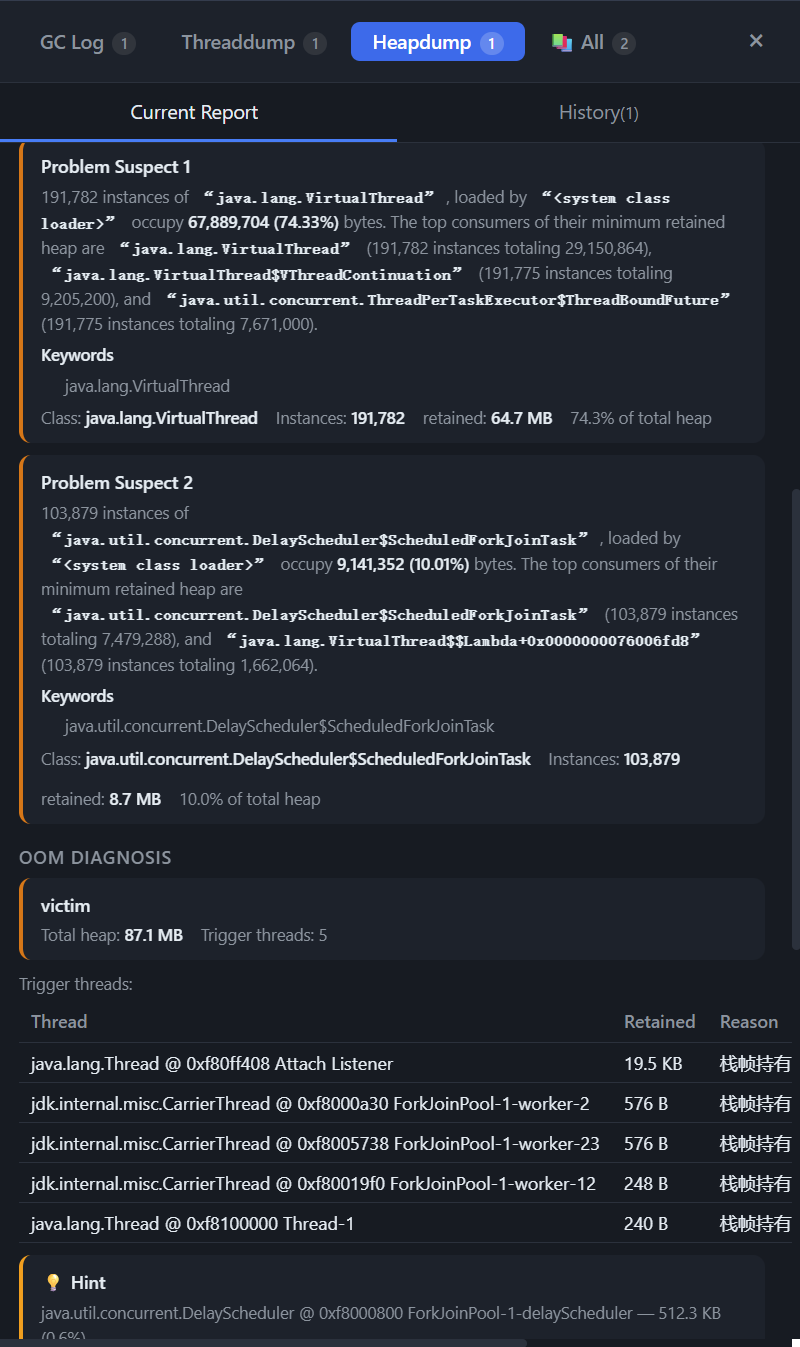
The thread dump looked surprisingly normal.
| Metric | Value |
|---|---|
| Total threads | 56 |
| RUNNABLE threads | 51 |
| BLOCKED threads | 0 |
| Deadlocks | 0 |
There were no deadlocks.
No obvious lock contention.
No large number of blocked worker threads.
The application was busy, but not stuck.
This ruled out synchronization as the primary cause.
Screenshot Placeholder
Step 3 — Heap Dump Analysis
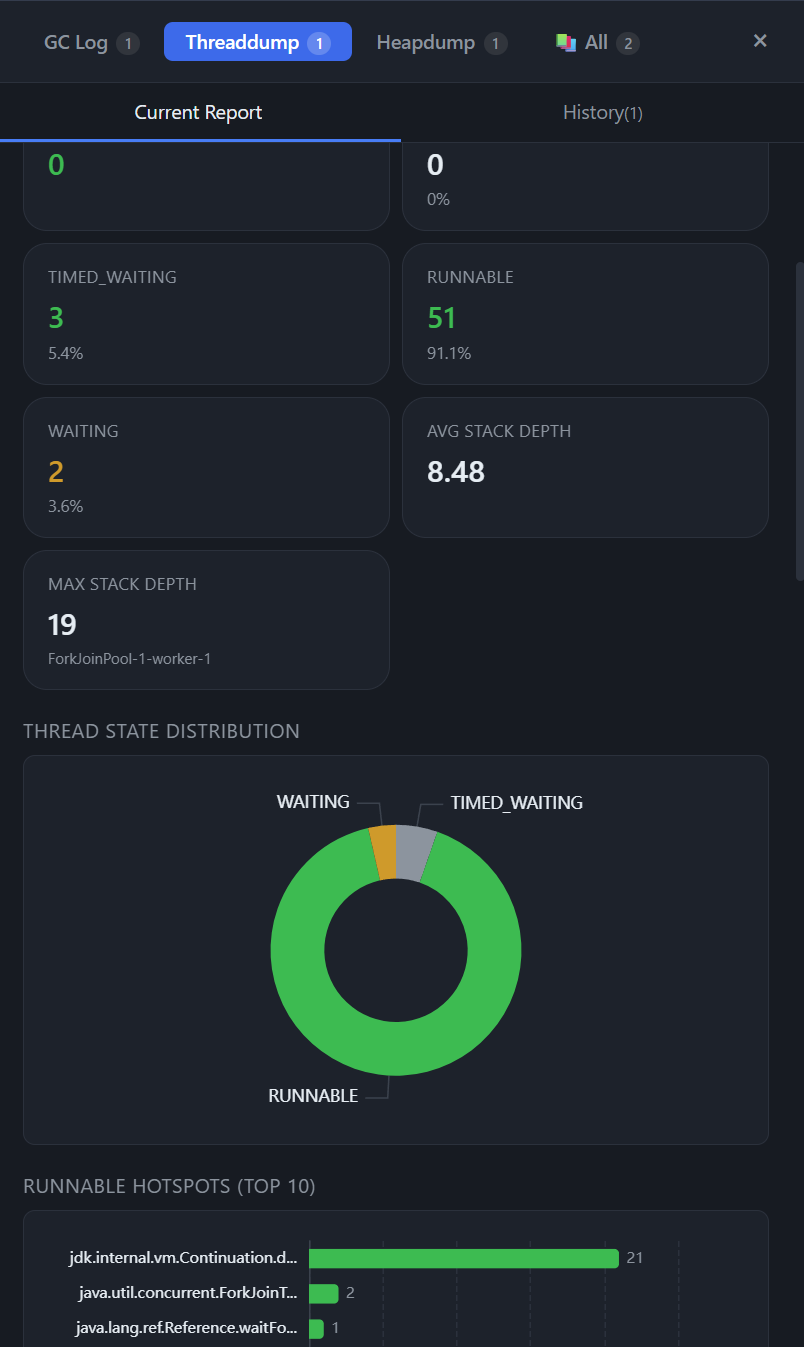
The heap dump changed the direction of the investigation.
Top retained objects:
| Class | Count | Retained Heap |
|---|---|---|
java.lang.VirtualThread |
191,782 | 64.7 MB |
VirtualThread$VThreadContinuation |
191,782 | 21.3 MB |
ThreadPerTaskExecutor$ThreadBoundFuture |
191,782 | 11.3 MB |
DelayScheduler$ScheduledForkJoinTask |
103,880 | 8.7 MB |
Nearly three quarters of the heap was retained by java.lang.VirtualThread.
At this point, the obvious question became:
Why are there almost 200,000 virtual threads?
Screenshot Placeholder
Step 4 — Inspecting the Application
The heap dump also revealed the benchmark class:
VirtualThreadBench
Important configuration values:
| Field | Value |
|---|---|
DEFAULT_THREAD_COUNT_STRESS |
10,000 |
DEFAULT_WORK_MS |
10 |
DEFAULT_RUN_SECONDS |
30 |
Another important field:
completed = 469,706
The benchmark had already completed nearly half a million virtual threads.
But 191,782 virtual threads were still alive.
That needed an explanation.
Step 5 — Executor Behavior
The submitter thread gave the missing clue.
The relevant stack looked like this:
ThreadPerTaskExecutor.close()
→ awaitTermination()
→ CountDownLatch.await()
The executor was waiting for submitted tasks to finish.
Meanwhile, the benchmark continued creating batches of virtual threads.
There was:
- No backpressure
- No concurrency limit
- No semaphore
- No bounded queue
Just continuous virtual thread creation.
Correlating the Evidence
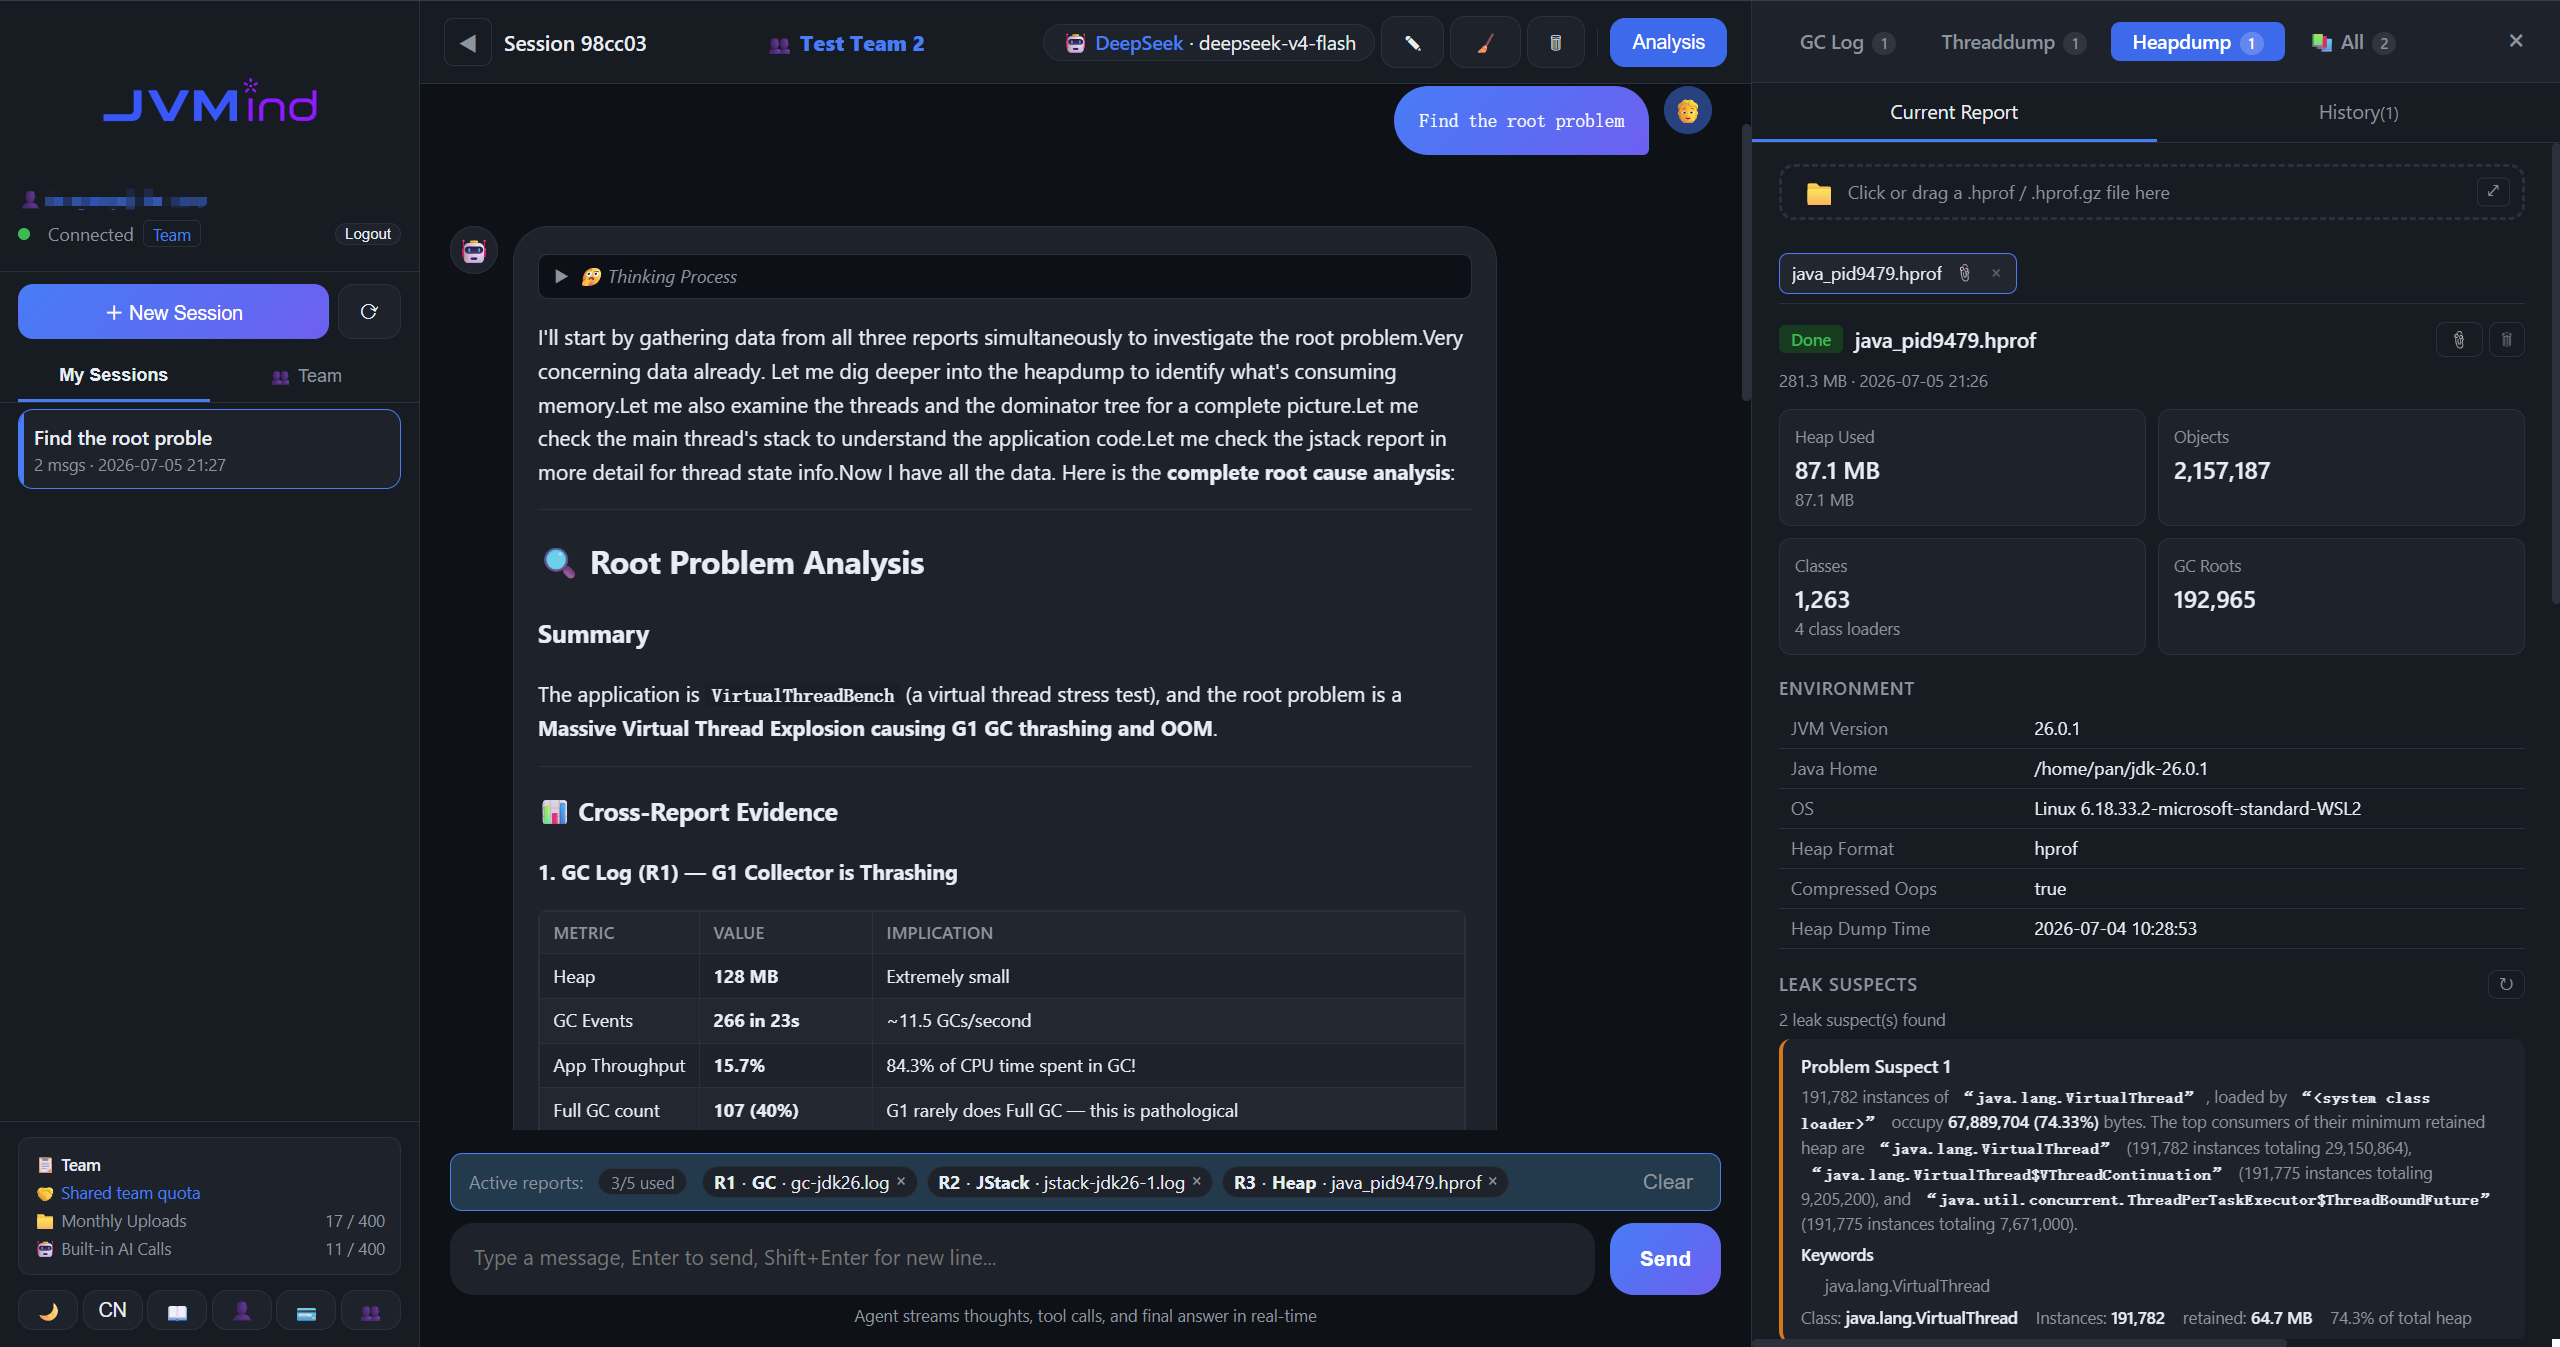
Now the evidence from all reports aligned.
GC log:
- Full GC ran repeatedly
- Full GC reclaimed almost nothing
- Throughput collapsed
Heap dump:
- 191,782 virtual threads were retained
- Virtual threads dominated heap usage
Thread dump:
- No deadlock
- No lock contention
- Executor was waiting in
awaitTermination()
Application:
- 10,000 virtual threads per batch
- 128MB heap
- No backpressure
flowchart TB
    GC["GC Logs<br/>107 Full GCs<br/>127MB → 127MB"]
    Heap["Heap Dump<br/>191,782 VirtualThreads<br/>74% of Heap"]
    Thread["Thread Dump<br/>awaitTermination()"]
    App["Application Logic<br/>10,000 VT per batch<br/>No Backpressure"]
    OOM["OutOfMemoryError"]

    GC --> Heap
    Heap --> Thread
    Thread --> App
    App --> OOM
Root Cause
This was not a traditional memory leak.
It was a design-level allocation pressure problem.
The application created virtual threads faster than the heap could accommodate them.
The heap was only 128MB, while allocation rate reached 157MB/s.
Each virtual thread is cheap, but not free. A virtual thread may retain:
VirtualThread- Continuation
- Stack chunks
- Task wrapper
- Future
- Scheduler-related objects
One virtual thread is cheap.
Hundreds of thousands are not.
Because the virtual threads and their related objects were still strongly reachable, Full GC had nothing useful to reclaim.
The JVM eventually entered this failure mode:
High allocation rate
→ Heap fills rapidly
→ Young GC cannot keep up
→ Full GC starts repeatedly
→ Full GC reclaims almost nothing
→ Application throughput collapses
→ OutOfMemoryError
Why Virtual Threads Make This Subtle
Virtual threads are a major improvement for Java concurrency.
They make blocking code much cheaper.
They also remove a limit many systems accidentally relied on.
Traditional thread pools impose a natural ceiling:
- The pool has a fixed size.
- The queue may be bounded.
- When both are full, the system pushes back.
Virtual threads change this behavior.
With Executors.newVirtualThreadPerTaskExecutor(), it becomes extremely easy to create a huge number of concurrent tasks.
The failure mode shifts from:
Thread pool exhaustion
to:
Heap exhaustion
This does not mean virtual threads are dangerous.
It means they still need backpressure.
Lessons Learned
Several changes would have prevented this incident.
1. Add backpressure
Use a Semaphore, rate limiter, bounded queue, or another concurrency limiter.
Virtual threads should not mean unlimited concurrency.
2. Size the heap for the workload
A 128MB heap is far too small for a workload allocating 157MB/s.
Even if objects are short-lived, the JVM still needs enough breathing room.
3. Monitor virtual thread counts
Virtual thread count should be treated as an important runtime signal.
A sudden spike may indicate:
- Missing backpressure
- I/O slowdown
- Executor misuse
- Request surge
4. Do not rely on GC to fix unbounded allocation
GC can reclaim unreachable objects.
It cannot fix objects that are still strongly referenced.
5. Correlate multiple diagnostic artifacts
GC logs alone did not explain the root cause.
Thread dumps alone looked healthy.
Heap dump alone showed the symptom but not the execution path.
The diagnosis required correlation.
Why Correlation Matters
Individually, each diagnostic artifact was incomplete.
The GC log suggested a GC crisis.
The thread dump suggested the application was mostly healthy.
The heap dump showed too many virtual threads, but not why they existed.
Only after correlating the data did the full picture emerge.
flowchart LR
    A["GC Logs<br/>Full GC cannot reclaim"] --> B["Heap Dump<br/>VirtualThread dominates heap"]
    B --> C["Thread Dump<br/>Executor waiting"]
    C --> D["Application Config<br/>10,000 VT batches"]
    D --> E["Root Cause<br/>Unbounded VT creation"]
JVM troubleshooting is not just about reading logs.
It is about connecting evidence.
Manually correlating GC logs, thread dumps, and heap dumps can take hours of back-and-forth analysis.
This is exactly the kind of workflow JVMind is designed to help with:
- Parse GC logs
- Analyze thread dumps
- Inspect heap structures
- Connect related symptoms
- Surface likely root causes with supporting evidence
Final Takeaway
Virtual threads are powerful.
But they remove many of the implicit limits that platform thread pools used to provide.
When virtual threads are combined with:
- Small heap
- High allocation rate
- Unbounded task submission
- No backpressure
They can overwhelm memory very quickly.
The key insight in this incident is not:
GC failed.
The real insight is:
GC was working correctly — there was simply nothing to reclaim.
Diagnose JVM Incidents Faster
Stop reading raw JVM logs manually.
Upload your GC logs, thread dumps, and heap dumps to JVMind and let the analyzer correlate the evidence for you.
Try the demo with sample data:
https://jvmind.io