Documentation
Introduction
JVMind is an AI-powered conversational assistant for Java Virtual Machine (JVM) performance troubleshooting. Upload your GC logs or thread dumps, ask questions in natural language, and get professional diagnostic reports with actionable recommendations.
Instead of manually parsing thousands of log lines or hunting for deadlocks in a massive thread dump, just upload your file and let the AI do the heavy lifting — it will analyze the data step-by-step and explain what's happening in plain English.
Key Features
GC Log Analysis
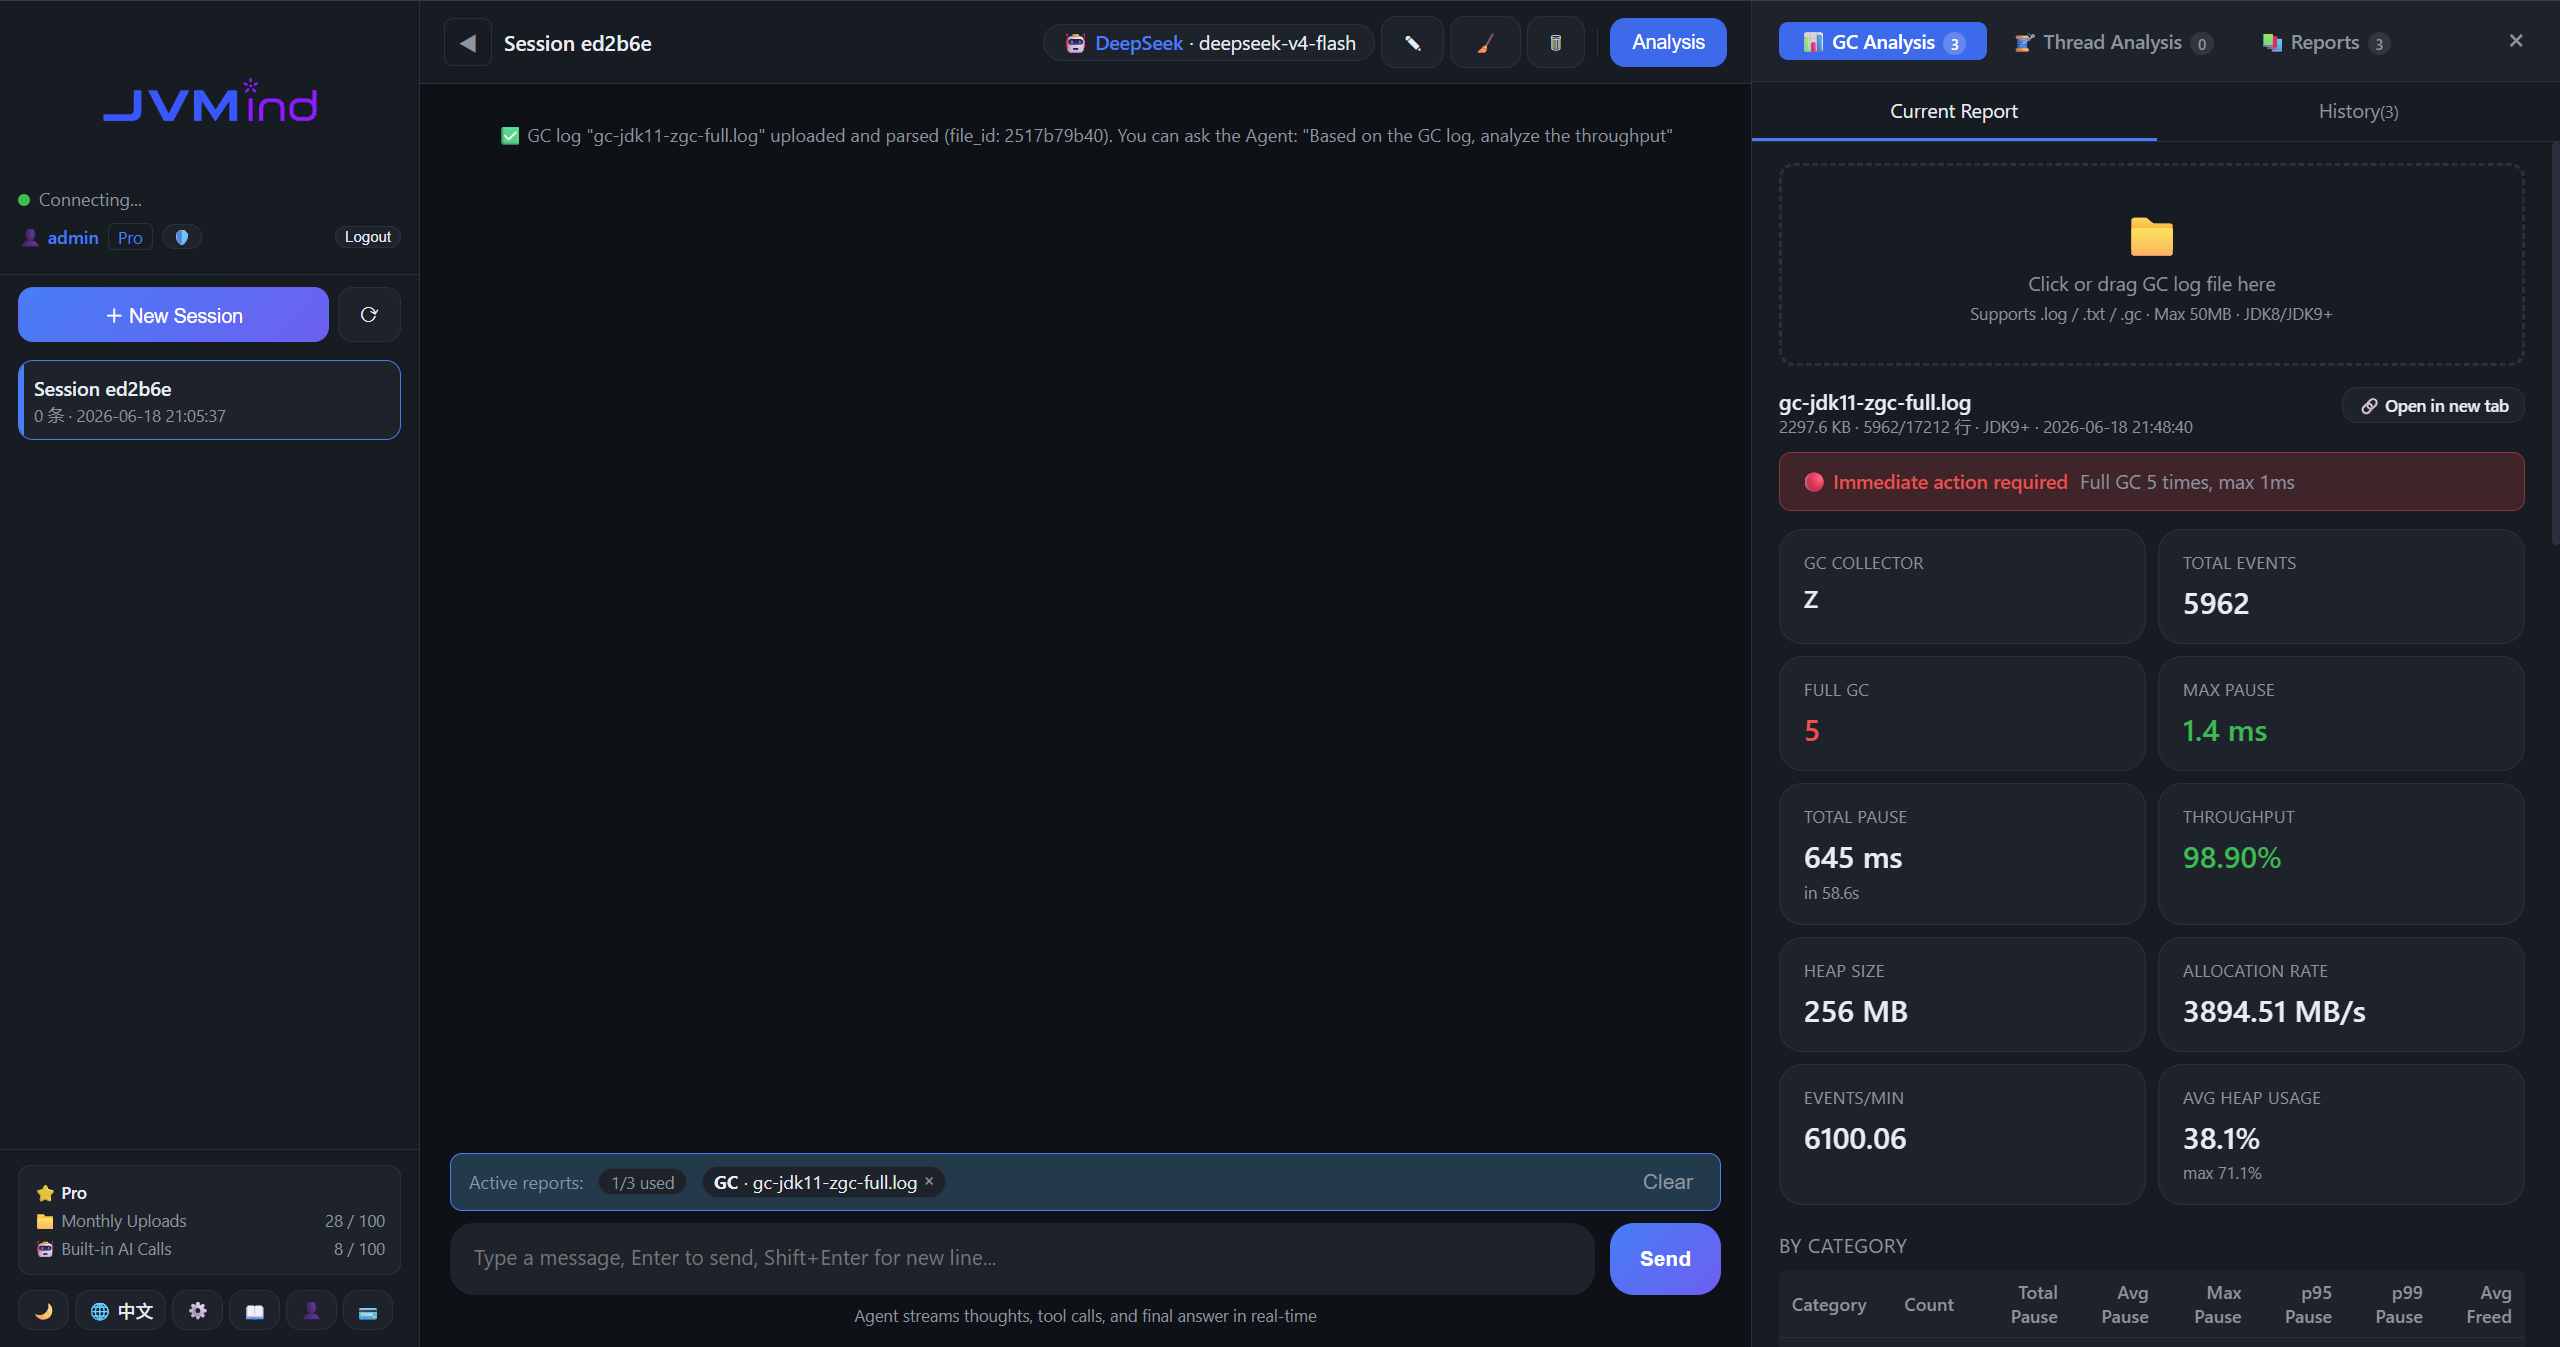
Upload GC logs and get automatic statistics — throughput, pause times, collector identification, top slowest GC events, and visualized charts.
Thread Dump Analysis
Upload jstack output to detect deadlocks, identify lock contention hotspots, and generate flame graphs of stack traces.
AI-Powered Chat
Ask questions about your analysis results in natural language. The AI uses ReAct reasoning to break down complex problems step-by-step.
Visual Charts
Heap usage curves, pause time distributions, and interactive flame graphs — all generated automatically.
Long-Term Memory
JVMind remembers facts about your environment across conversations, giving you more contextual answers over time.
Flexible LLM Backend
Works with OpenAI, DeepSeek, Qwen, Kimi — or any OpenAI-compatible API.
GC Log Analysis
How to Generate GC Logs
Before uploading, make sure your JVM is configured to output GC logs:
| JDK 8 | -XX:+PrintGCDetails -Xloggc:gc.log |
| JDK 9+ | -Xlog:gc*:file=gc.log |
How to Analyze
- Start a new conversation, or switch to an existing one
- Click the Analysis button on the top bar to open the analysis panel
- In the GC tab, drag & drop your GC log file, or click to select it
- Wait for the analysis to complete — you'll see statistics and charts appear
- In the chat, ask the AI to diagnose: "Please analyze this GC log and give me optimization suggestions"
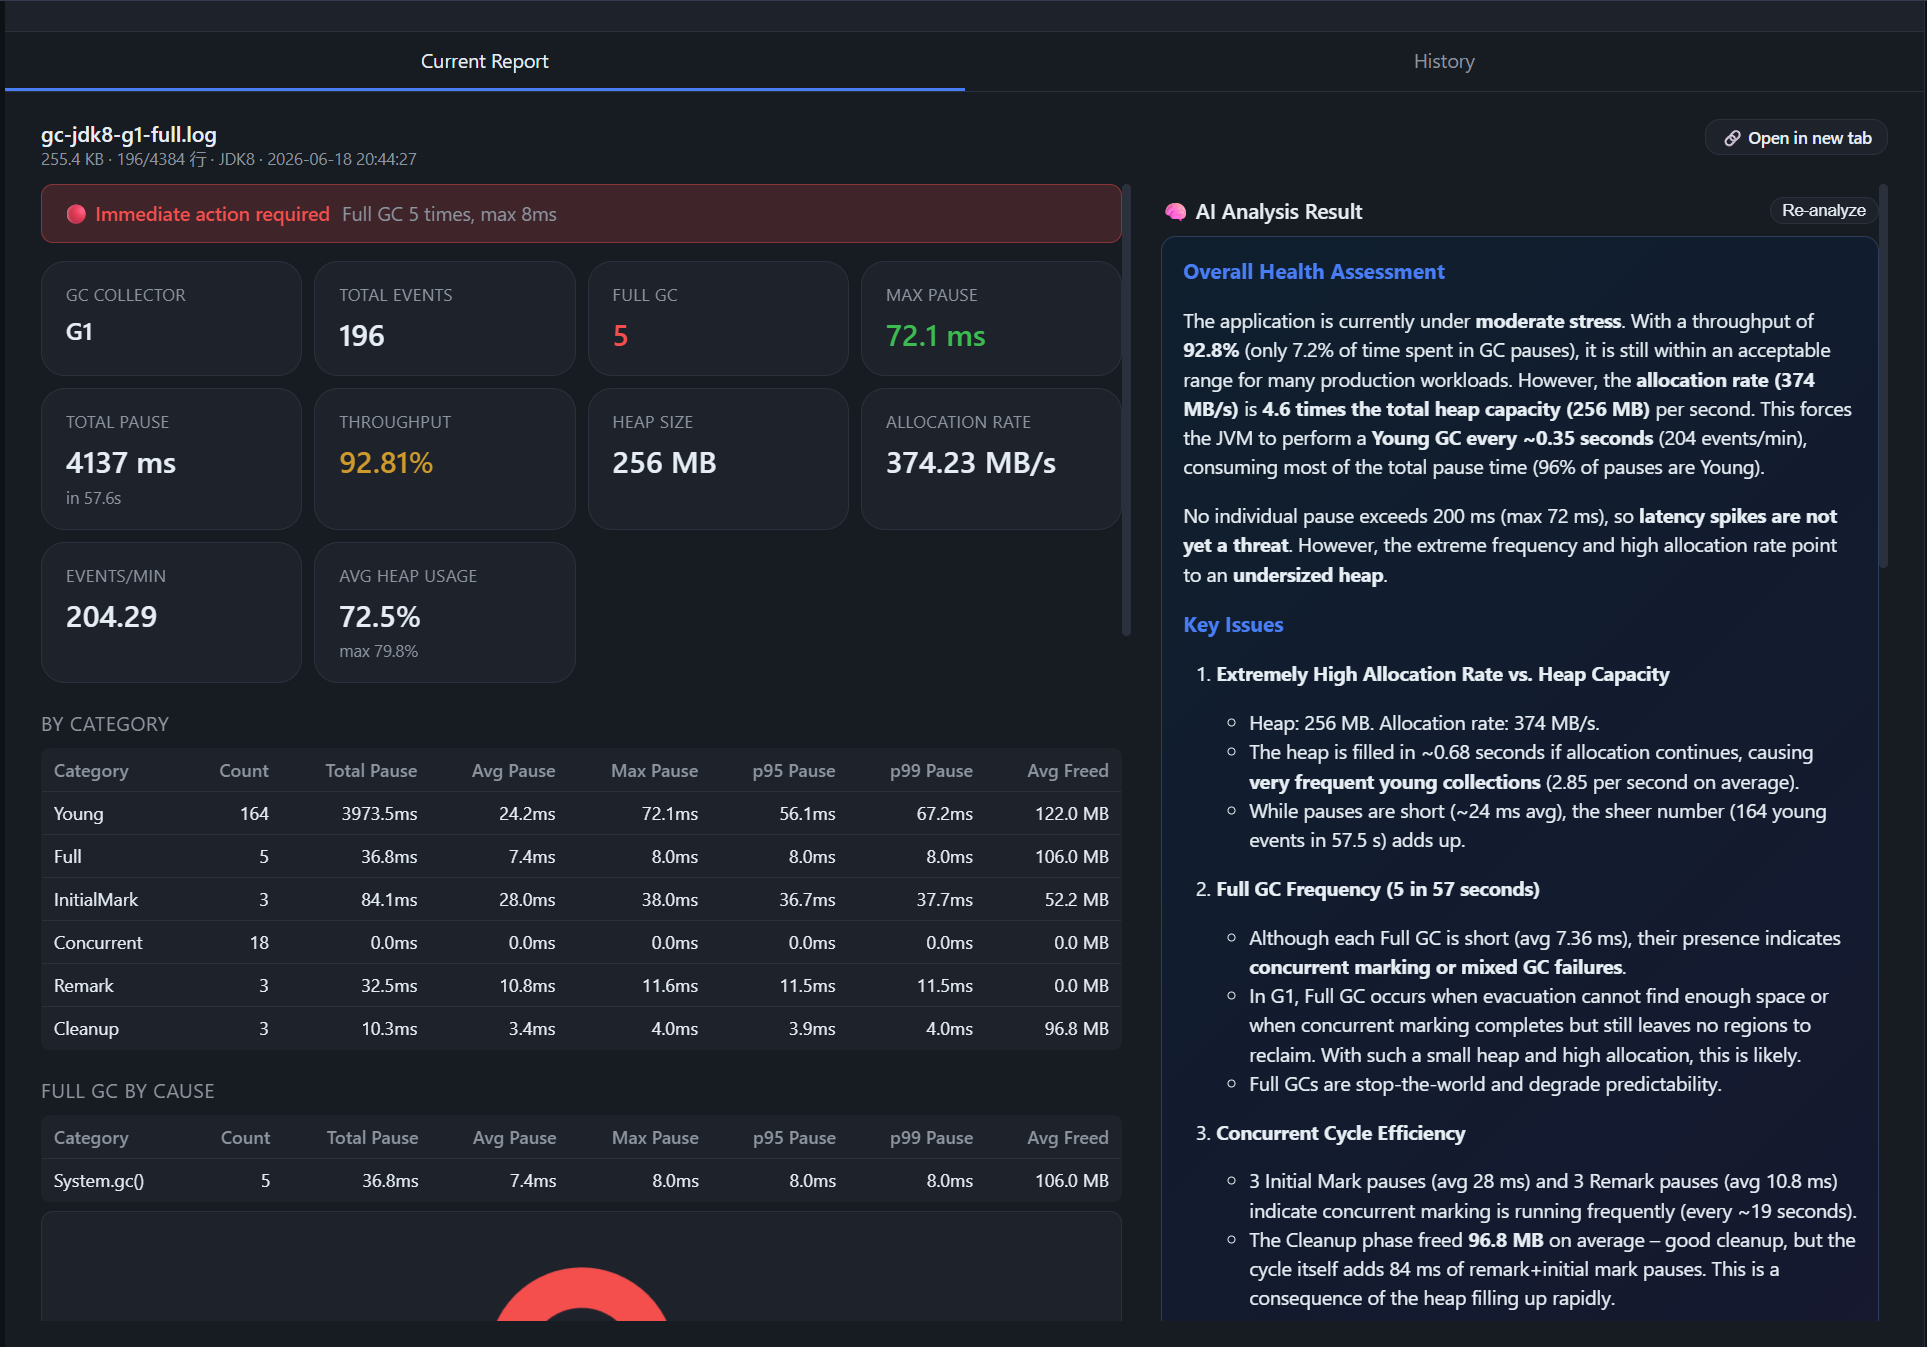
What Gets Analyzed
- Collector Identification — automatically detects G1, Parallel, Serial, Shenandoah, or ZGC
- Heap Summary — min, max, and average heap usage
- GC Statistics — counts by category (Young, Mixed, Full)
- Throughput — percentage of time the application spends running vs GC pausing
- Pause Time Analysis — total, average, P95, P99 percentiles
- Top 10 Slowest — GC events with the longest pauses
- Full GC by Cause — breakdown of what triggered each Full GC
- Charts — heap usage timeline, pause time distribution histogram
Tip: For the best AI diagnosis, upload the GC log first, then ask questions in the chat. The AI will automatically reference the already-uploaded analysis data.
Example Questions to Ask
- "What's the throughput? Is that healthy?"
- "Why are there so many Full GCs?"
- "Check if this looks like a memory leak"
- "What should I adjust to reduce Young GC pause time?"
Thread Dump Analysis
How to Capture a Thread Dump
Use the jstack command for classic text format (all JDK versions):
jstack -l <pid> > threads.txtOr use jcmd for the JSON format (JDK 21+, includes virtual thread metadata):
jcmd <pid> Thread.dump_to_file -format=json threads.jsonOr capture directly in JVMind using the jstack tab's built-in capture tool (requires the agent to be running on your JVM host).
How to Analyze
- Open the analysis panel ( button on the top bar)
- Select the jstack tab
- Upload your thread dump file
- Ask the AI to diagnose: "Find any deadlocks or lock contention in this thread dump"
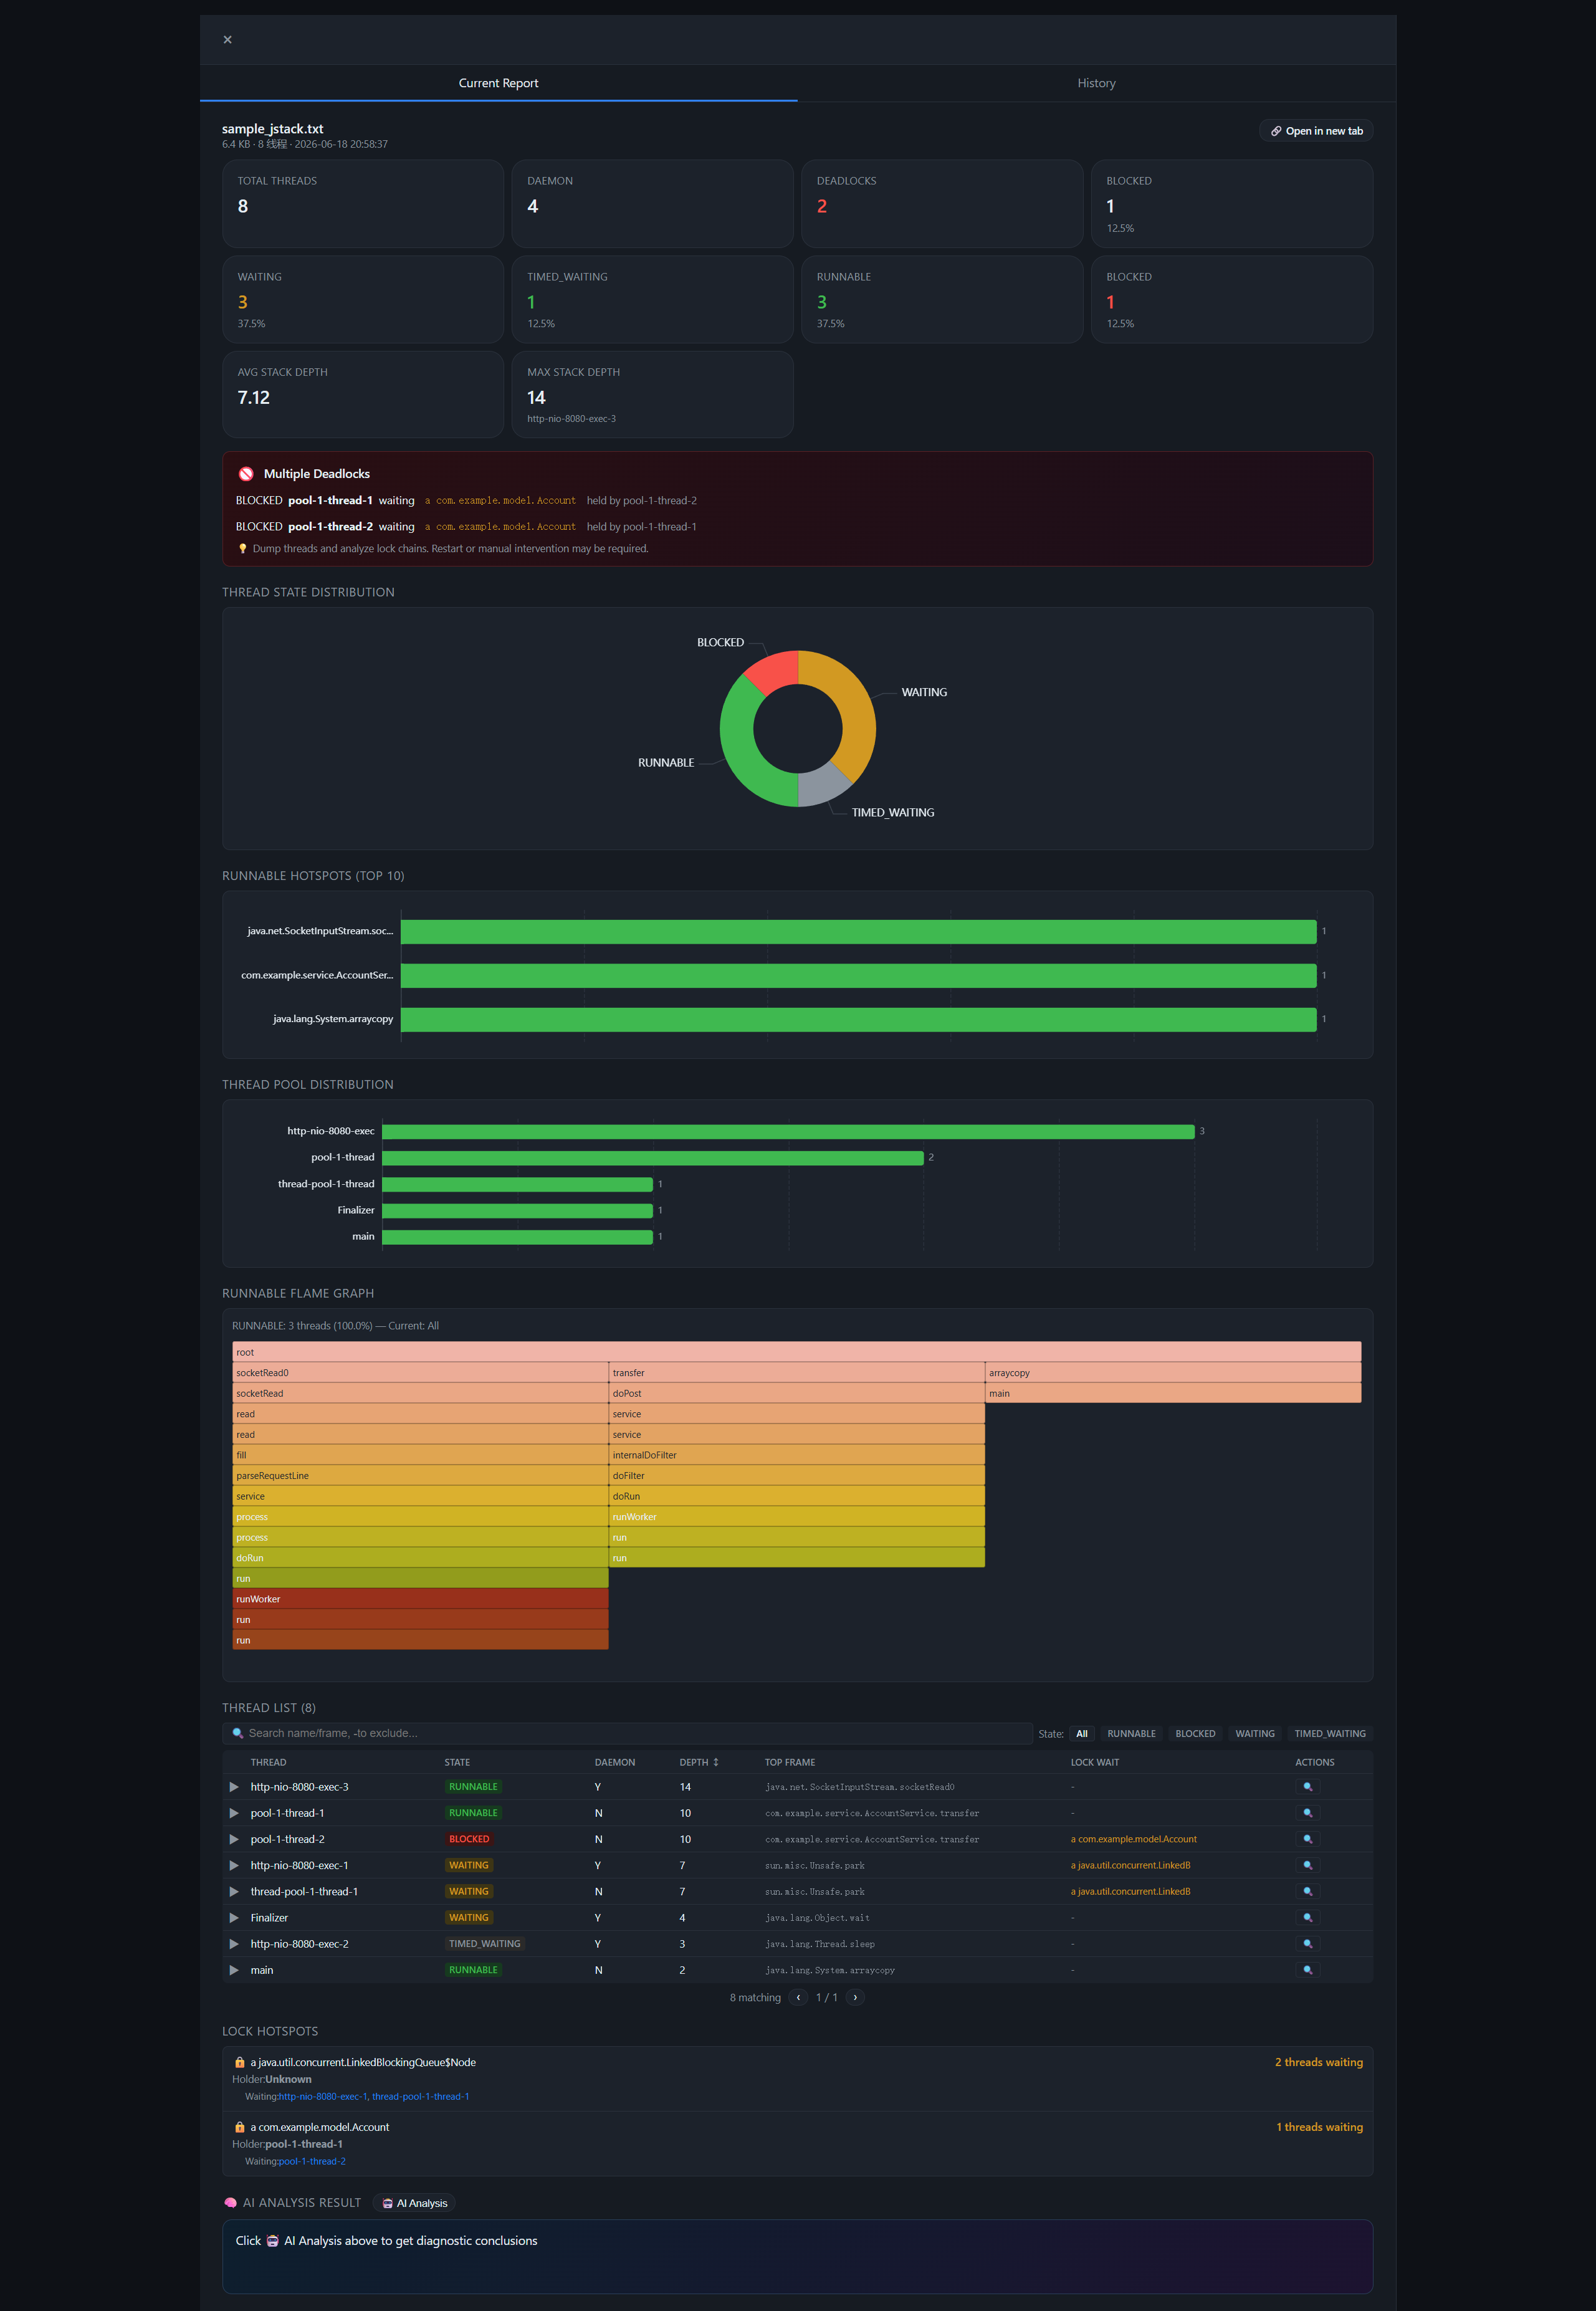
What Gets Analyzed
- Thread State Distribution — counts of RUNNABLE, BLOCKED, WAITING, TIMED_WAITING threads
- Deadlock Detection — automatically finds circular deadlocks and displays the full wait chain
- Lock Contention — identifies which locks cause the most blocking
- Thread Grouping — groups threads by name prefix (e.g., Tomcat worker threads, GC threads)
- CPU Hotspot Detection — which methods appear most frequently on RUNNABLE threads
- Flame Graph — interactive flame graph of all stack traces
- Virtual Threads (JSON only) — count of virtual threads, TERMINATED threads, and thread-container distribution (ForkJoinPool.commonPool, ThreadPerTaskExecutor, …). Unnamed virtual threads are synthesized as
VThread-<container>#<tid>for grouping.
Example Questions to Ask
- "Is there a deadlock? Show me the full chain"
- "Why is CPU so high? Which threads are running?"
- "Check for any threads blocked on the same lock"
- "Help me understand this flame graph — what should I optimize?"
Configuration
LLM Settings
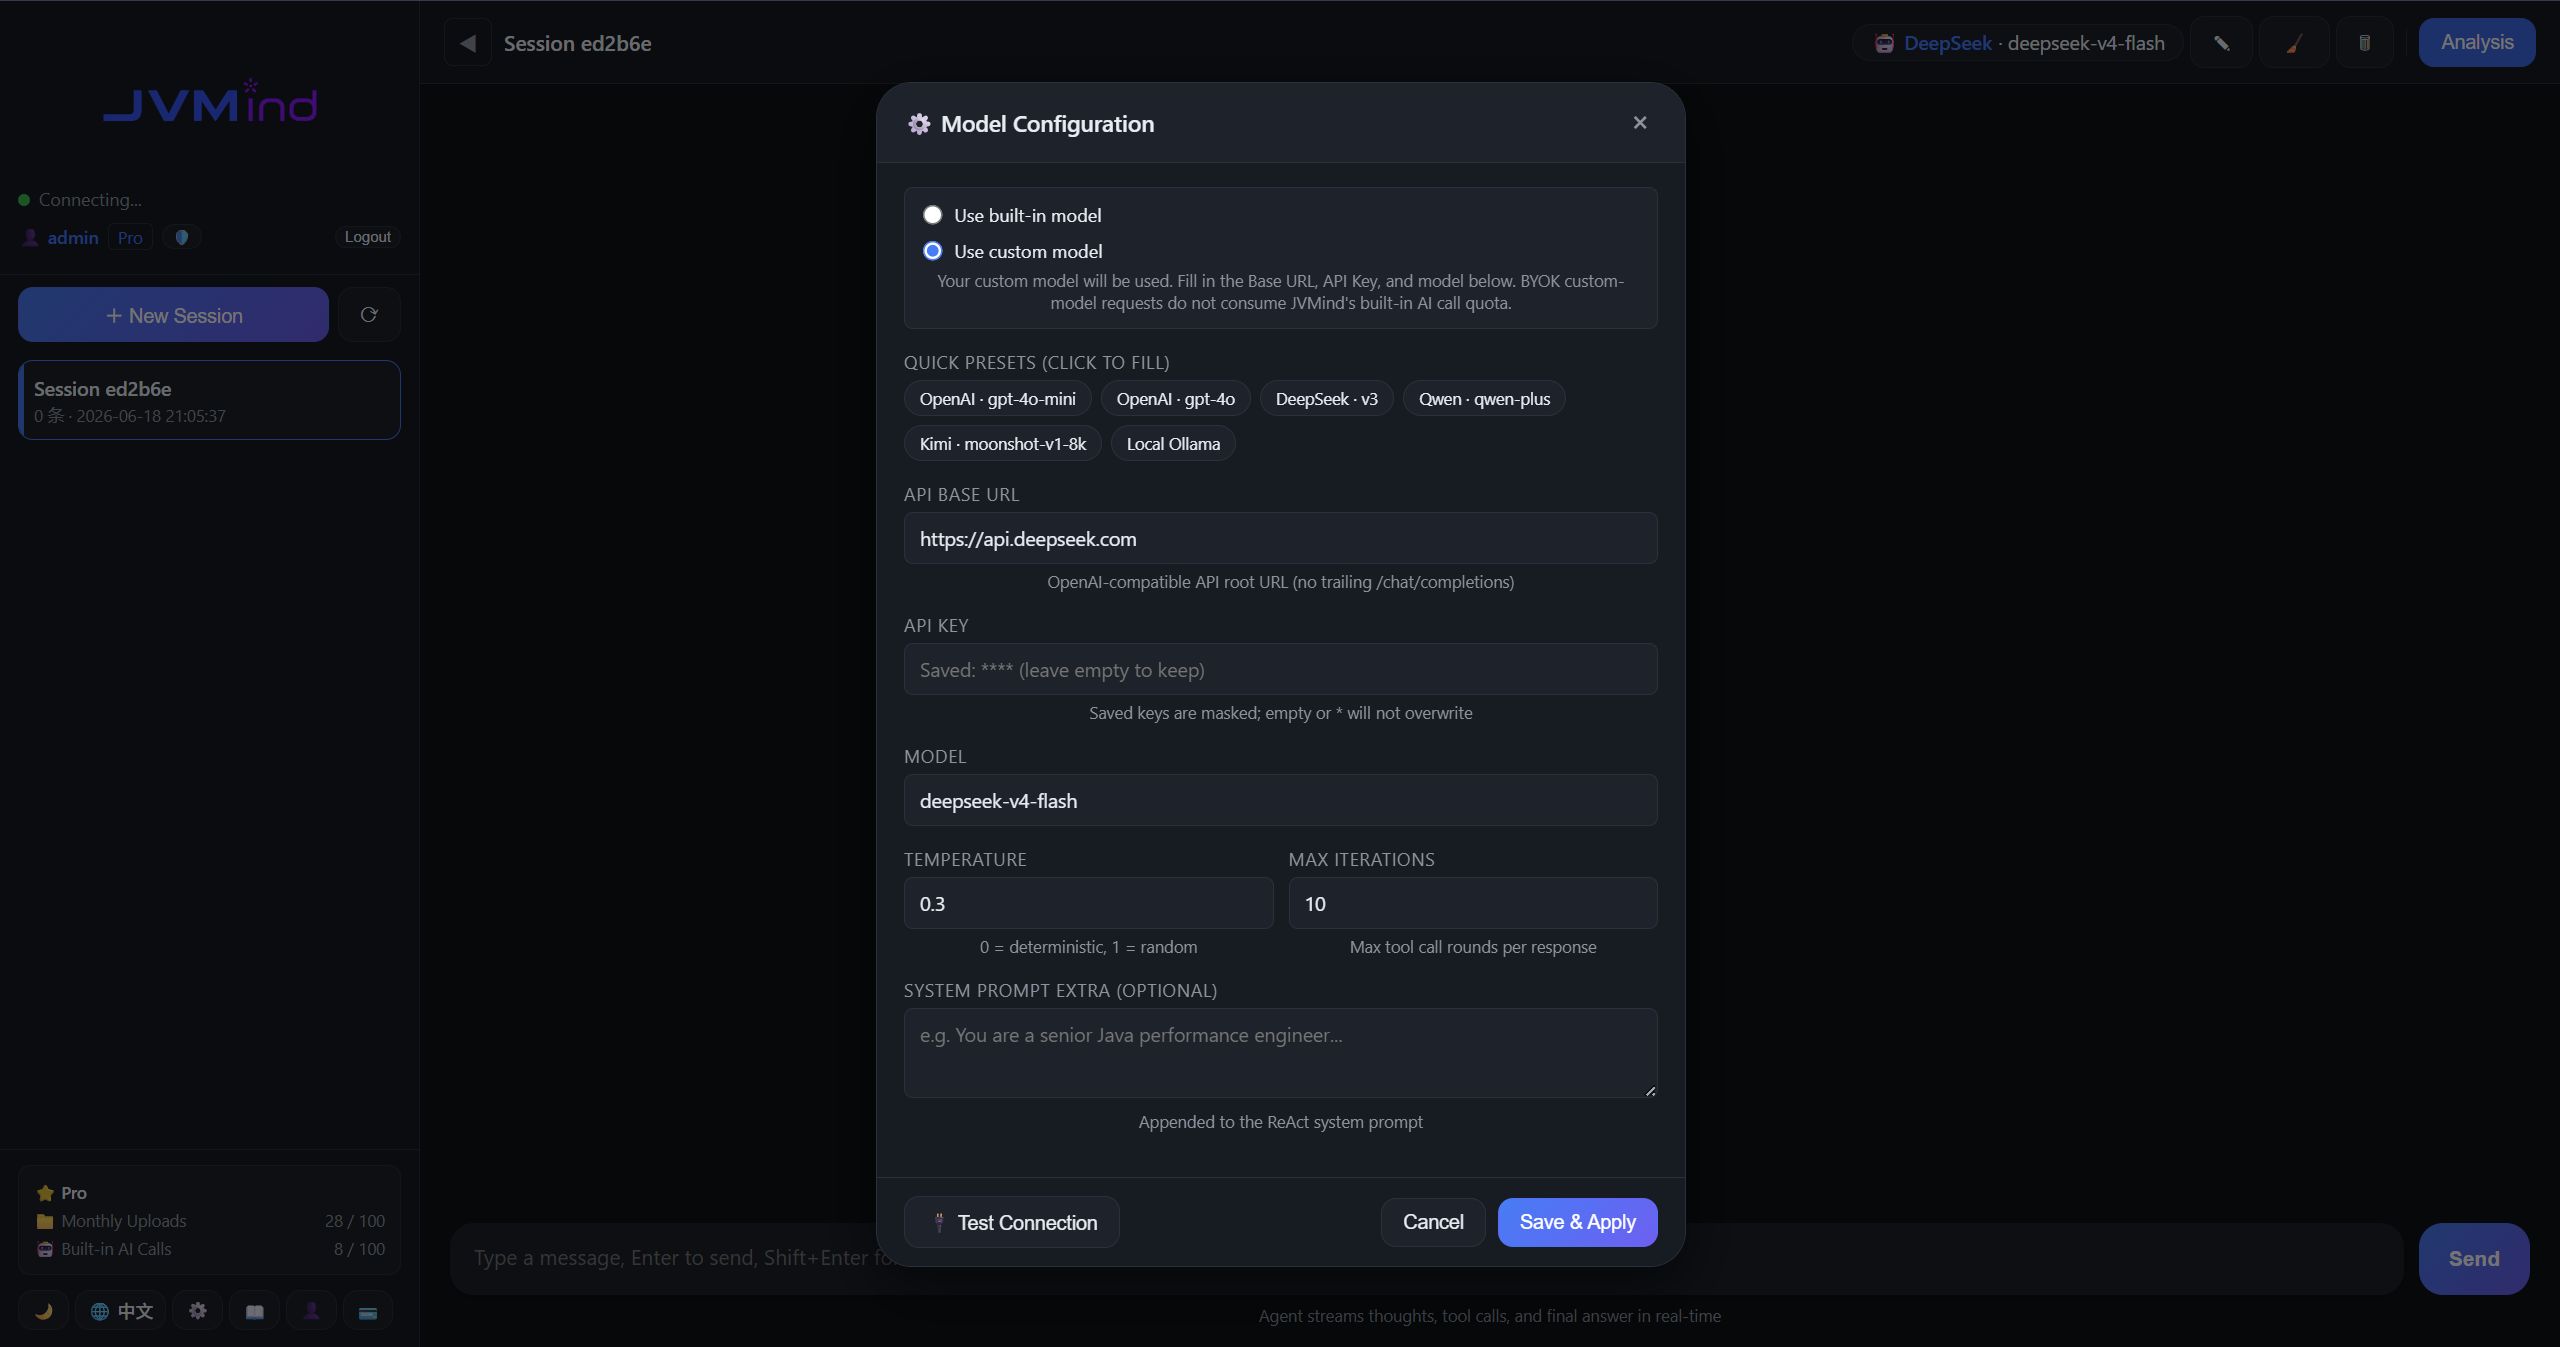
Click the button in the sidebar to open the configuration dialog:
| API Key | Your API key for the LLM provider |
| Base URL | API endpoint (customize for self-hosted or third-party providers) |
| Model | Which model to use (e.g., gpt-4o, deepseek-chat) |
| Temperature | Controls response creativity: lower = more deterministic, higher = more creative |
| Max Iterations | Maximum ReAct reasoning steps the AI can take (higher = more thorough, but slower) |
| System Prompt | Extra instructions to guide the AI's behavior |
After saving, click "Test Connection" to verify your settings work before starting a conversation.
Supported Providers
JVMind includes presets for popular LLM providers:
- OpenAI — GPT-4o, GPT-4o-mini
- DeepSeek — deepseek-chat, deepseek-coder
- Alibaba Cloud — Qwen (通义千问)
- Moonshot — Kimi
Conversation Guide
How the AI Thinks
JVMind uses the ReAct (Reasoning + Acting) framework. When you ask a question, the AI:
- Thinks about what information it needs
- Calls a tool (e.g., analyzes GC log, reads a report, calculates something)
- Observes the result
- Repeats until it has enough context to give a complete answer
The entire thought process is visible in the conversation — you can see exactly how the AI reached its conclusions.
Tips for Better Answers
- Be specific — "Check if the Full GC pause time is causing latency issues" is better than "Is GC OK?"
- Upload first, ask second — upload your GC log or jstack file before asking about it
- One topic at a time — focus on one issue per message for clearer analysis
- Use the memory feature — add facts about your application in the sidebar memory panel so the AI remembers them across conversations
Memory
The sidebar Memory panel lets you save facts the AI should remember, such as:
- Your JVM version and heap size
- Your application's traffic patterns
- Previous optimization attempts and their results
The AI automatically references saved facts in future conversations for more contextual answers.
Supported Formats
GC Collectors
| JVM Version | GC Collector | Support |
|---|---|---|
| JDK 8 | Serial, Parallel, CMS, G1 | |
| JDK 9+ | G1 | |
| JDK 9+ | Parallel / Serial | |
| JDK 12+ | Shenandoah | |
| JDK 11 — JDK 25 | ZGC (incl. Generational) |
Thread Dump Formats
JVMind supports two thread dump formats, auto-detected on upload:
- Text (
jstack -l) — the classic format, works on all JDK versions. Extensions:.txt,.log,.tdump,.jstack. - JSON (
jcmd Thread.dump_to_file -format=json) — introduced in JDK 21, the only way to see virtual thread details (JEP 444). Extension:.json. Adds statistics for virtual threads, terminated threads, and thread containers (executor / ForkJoinPool grouping).
Files must be UTF-8 encoded (or plain ASCII).
ZGC Specifics
JVMind correctly handles ZGC's multi-phase pause structure by accumulating pause times from all phases of the same GC cycle. It also recognizes both the older Garbage Collection (System.gc()) format and the JDK 25+ Major Collection (System.gc()) format for detecting explicit Full GC triggered by System.gc().
Frequently Asked Questions
Q: Is my data sent to the AI provider?
The analysis results (statistics, not the raw file) are sent to the LLM you configured for diagnosis. The raw file stays on the JVMind server.
Q: Does it work with application servers like Tomcat or Jetty?
Yes — JVMind works with any Java application regardless of the application server or framework. It only needs the GC log or thread dump.
Q: What about very large log files?
File size limits: Loading.... Your current plan's limit is shown in the app sidebar.
Q: How accurate is the AI diagnosis?
The AI provides professional-level analysis comparable to an experienced performance engineer. However, always verify critical recommendations before applying them to production, especially if your log doesn't contain full context.
Q: Can I analyze multiple files at once?
You can upload multiple GC log files or thread dumps to a single conversation. Each will appear in the analysis panel's history, and the AI can compare them.
Q: Does JVMind work with rotating GC logs?
Yes — upload them individually or concatenate them into one file before uploading.