JDK 8 vs JDK 11: G1GC under invokedynamic Stress
Yesterday, I came across a GC question on StackOverflow about a Groovy 4 application. The user reported that their app triggered a 1-second Full GC punctually every day, and adjusting MaxGCPauseMillis had no effect. The question remained unanswered.
To verify the actual behavior of this issue across different JDK versions, I wrote an extreme test program to reproduce the scenario. The test program was AI-assisted, heavily triggering invokedynamic via Groovy scripts. To eliminate variables and ensure a fair comparison, I fixed the heap size and hard-limited Metaspace, running the exact same workload under both JDK 8 and JDK 11. After generating the GC logs, I uploaded them to JVMind for automatic comparative analysis.
JVMind Automatic Analysis Results
The following data was automatically generated by JVMind parsing the GC logs.
1. Headline Metrics
| Metric | JDK 8 | JDK 11 | Delta |
|---|---|---|---|
| Application Throughput | 91.67% | 95.05% | +3.38 pp |
| Total Pause Time | 3,683.7 ms | 1,596.1 ms | -56.7% |
| Avg Allocation Rate | 568.73 MB/s | 301.24 MB/s | -47% |
| Log Duration | 44.22 s | 32.24 s | — |
| Total GC Events | 336 | 269 | — |
JDK 11 wins decisively in overall performance. Notably, JDK 8 allocates nearly 2x faster (569 vs 301 MB/s) for the same workload. This strongly suggests JDK 8's invokedynamic implementation generates significantly more intermediate/temporary objects — the same Groovy code path produces less garbage on JDK 11.
2. Pause Time by Category (The Real Story)
| Category | JDK 8 Avg | JDK 11 Avg | JDK 8 Max | JDK 11 Max | JDK 8 p99 | JDK 11 p99 |
|---|---|---|---|---|---|---|
| Young | 25.45 ms | 10.20 ms | 370 ms ⚠️ | 24.13 ms | 94.96 ms | 21.72 ms |
| Mixed | 20.42 ms | 6.97 ms | 35.93 ms | 16.07 ms | 34.43 ms | 15.22 ms |
| Cleanup | 3.76 ms | 0.33 ms | 4.43 ms | 0.56 ms | — | — |
| Remark | 3.42 ms | 5.21 ms | 10.92 ms | 7.57 ms | — | — |
| Full GC | — | 92.69 ms | — | 92.69 ms | — | — |
3. The Most Lethal Difference: Young GC
JDK 11's Young GC is 2.5x faster on average (10.2 ms vs 25.4 ms). The tail latency story is even more dramatic: JDK 8's p99 is 94.96 ms vs JDK 11's 21.72 ms — a 4.4x improvement.
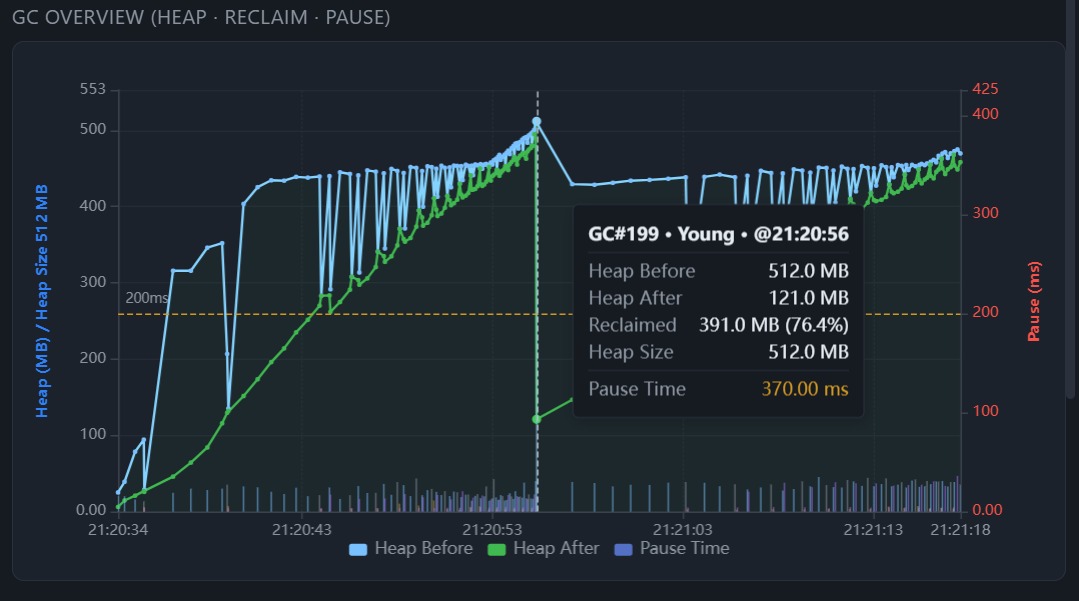
The JDK 8 370 ms Young GC spike is alarming. This single event accounts for ~10% of JDK 8's total pause budget and would be unacceptable in any latency-sensitive application. JDK 11's worst Young pause is only 24 ms.
Below is the GC duration curve for the JDK 8 test program. The most glaring spike is a Young GC, hitting 370ms directly:
4. Catastrophic Young Pause vs Moderate Full GC
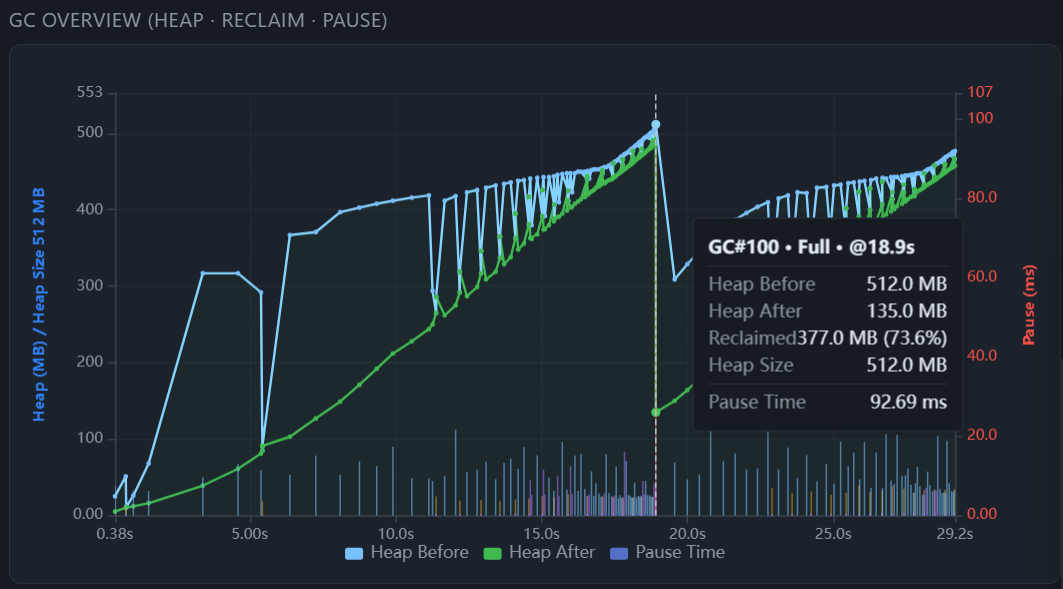
An interesting finding from the JVMind analysis is that JDK 11 had 1 Full GC (92.7 ms), while JDK 8 had none. However, JDK 8's 370 ms Young pause is effectively worse than JDK 11's Full GC. One catastrophic Young pause > one moderate Full GC.
JDK 11 adopts an active strategy, triggering a Metadata GC Threshold type Full GC when Metaspace hits the limit. Because it triggers early, the pause is controllable. JDK 8 tries to delay it, leading to extreme allocation pressure that eventually causes a standard Young GC to spiral out of control into a 370ms STW catastrophe.
Below is the GC duration curve for the JDK 11 test program. Even including the 1 Full GC, the maximum pause is only 92ms:
Technical Root Cause
Groovy 4 heavily uses invokedynamic, which generates a large number of LambdaForm$MH adapter classes on JDK 8. When Metaspace is bursting, G1 triggers a concurrent marking cycle to unload these classes. In the original poster's log, there is a line [Unloading, 0.4803602 secs] — nearly half a second of STW spent entirely on scanning and unloading classes.
Beyond the class unloading overhead, JDK 8's early G1 implementation simply struggles under this pressure. JDK 11's G1 has years of improvements (G1 was fully mature only by JDK 9+). Young, Mixed, and Cleanup pauses are all dramatically faster and more predictable. Furthermore, JDK 11's JIT and runtime generate significantly less allocation pressure from the same invokedynamic bytecode, reducing both GC frequency and per-event cost.
For any service with SLAs, JDK 8 is simply not viable at this level of invokedynamic stress. Upgrading from JDK 8 to JDK 11+ is a high-ROI move — you get both better throughput and dramatically better pause time predictability with zero code changes.
Regarding StackOverflow's Anti-AI Mechanism
This whole troubleshooting thought process and test results were pretty smooth. Since I'm not a native English speaker, I used AI to translate it into English to ensure the terminology was accurate, and casually pasted it under that SO question. And guess what? It was directly blocked by the system, flagged as AI-generated content, refused publication, and got my account banned.
Honestly, it's quite frustrating. Isn't SO's anti-AI movement getting a bit deranged now? Is it a crime for a non-native English developer to use AI translation to ensure accuracy? Their detection system doesn't care whether the underlying technical logic was deduced by a human brain. As long as the sentence structure is neat and doesn't have that "casual spoken" vibe, it's a blanket ban. So I'm forced to post broken Chinglish full of grammatical errors to be considered a "real person"? This essentially blocks the path for non-native developers to bridge the language gap. Fine, if they don't want it posted, I'll just put it on my own blog.
Conclusion
For GC logs suffering from Metaspace and invokedynamic pressure like this, if you don't want to analyze them line by line, you can directly upload them to JVMind.io. The AI Agent will automatically catch the class unloading bottlenecks, compare allocation rates, and pinpoint tail latency spikes. SO can do whatever they want with their reviews; technical problems ultimately rely on tools and logic.